Document Preparation
Your AI Assistant performs best when source material is clear and structured. Well-organized files with clear headings, readable text, and simple tables let the system index content precisely — so answers stay relevant and grounded in your actual material. This guide covers which file formats work best, what good documents look like, and how to prepare common problem areas — complex tables, charts, and diagrams — before uploading. Most documents need only minor adjustments; preparation effort scales with content complexity.
Preferred document types
These formats preserve text structure and give the most consistent results.
| Format | Best for |
|---|---|
| Policies, whitepapers, case studies, long-form guides | |
| DOCX | Product documentation, SOPs, FAQs, internal playbooks |
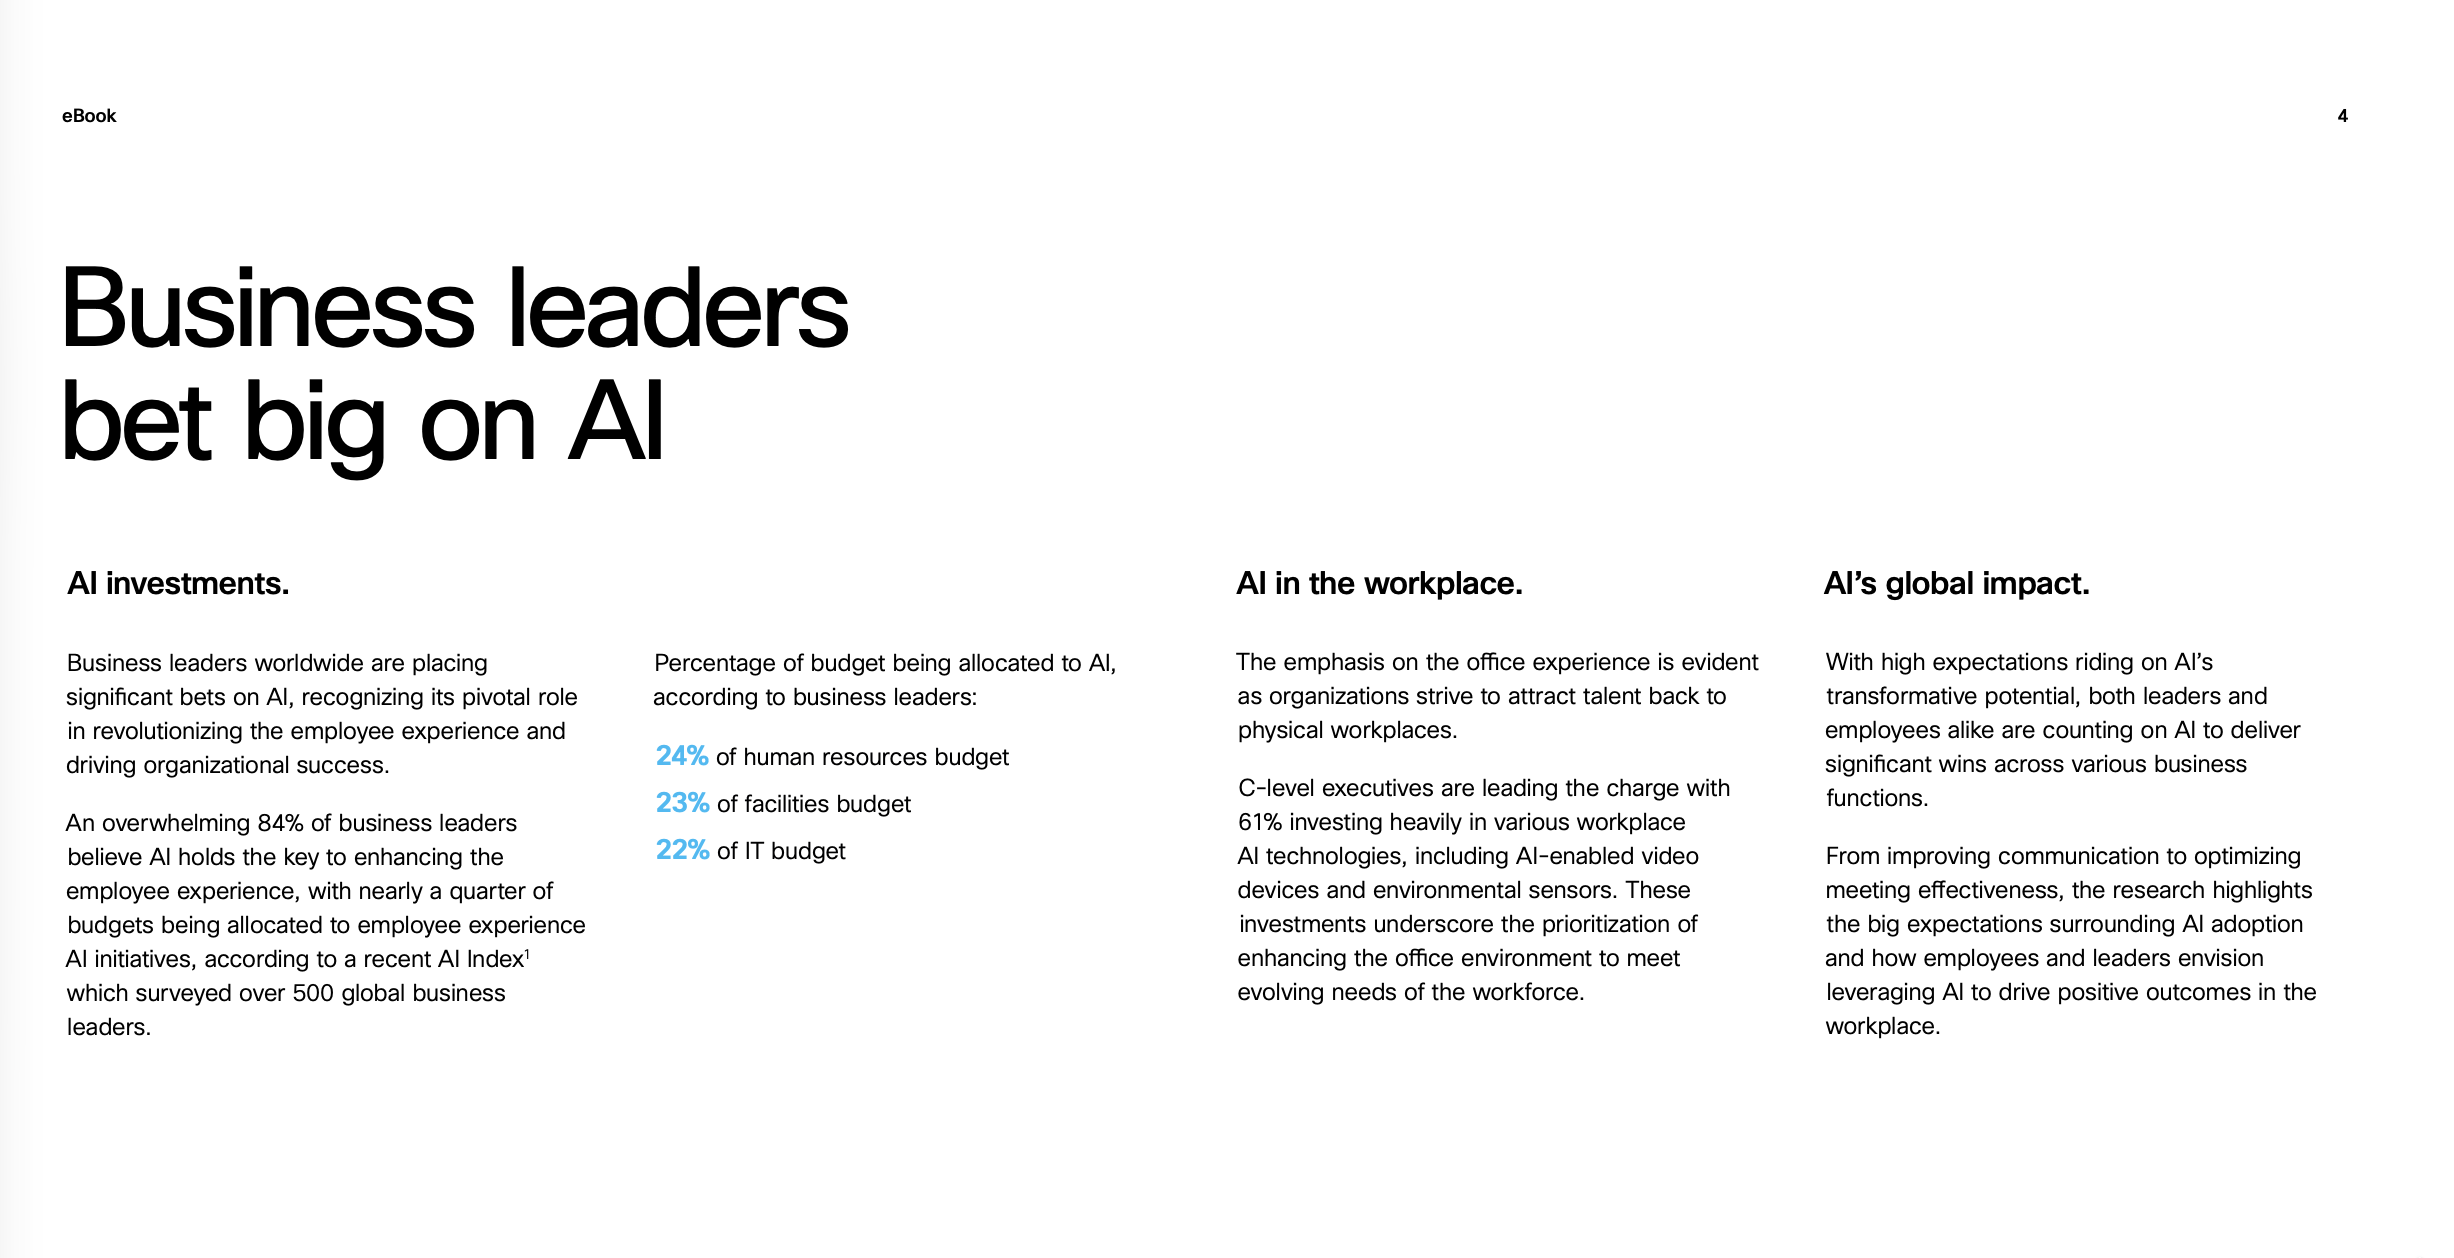
| PPTX | Decks with clear slide titles and bullet points |
| TXT | Transcripts, call notes, exported knowledge base articles |
| JPG / PNG | Screenshots and images of text-heavy content (reports, slides, signs) |
Documents that work well with AI systems
Use these patterns to keep extraction clean and responses accurate.
Characteristics of a clean document
- Headings create a clear hierarchy (H1 → H2 → H3)
- Each section has a single topic and short paragraphs
- Lists use bullets or numbers instead of dense blocks of text
- Tables are simple and have one header row
- Text is readable with strong contrast and minimal background noise
Clean, structured examples are the easiest for the AI to index. You can keep branding — just make sure the core text is clear and consistent.
Documents that need preparation
The documents below need minor preparation before upload. Follow the steps to make them AI-ready.
Tables
Tables lose structure when flattened into text. Preparation depends on table type: layout complexity vs. structured datasets.
Layout issues
Tables with merged cells or multi-level headers need reshaping to keep the meaning intact.
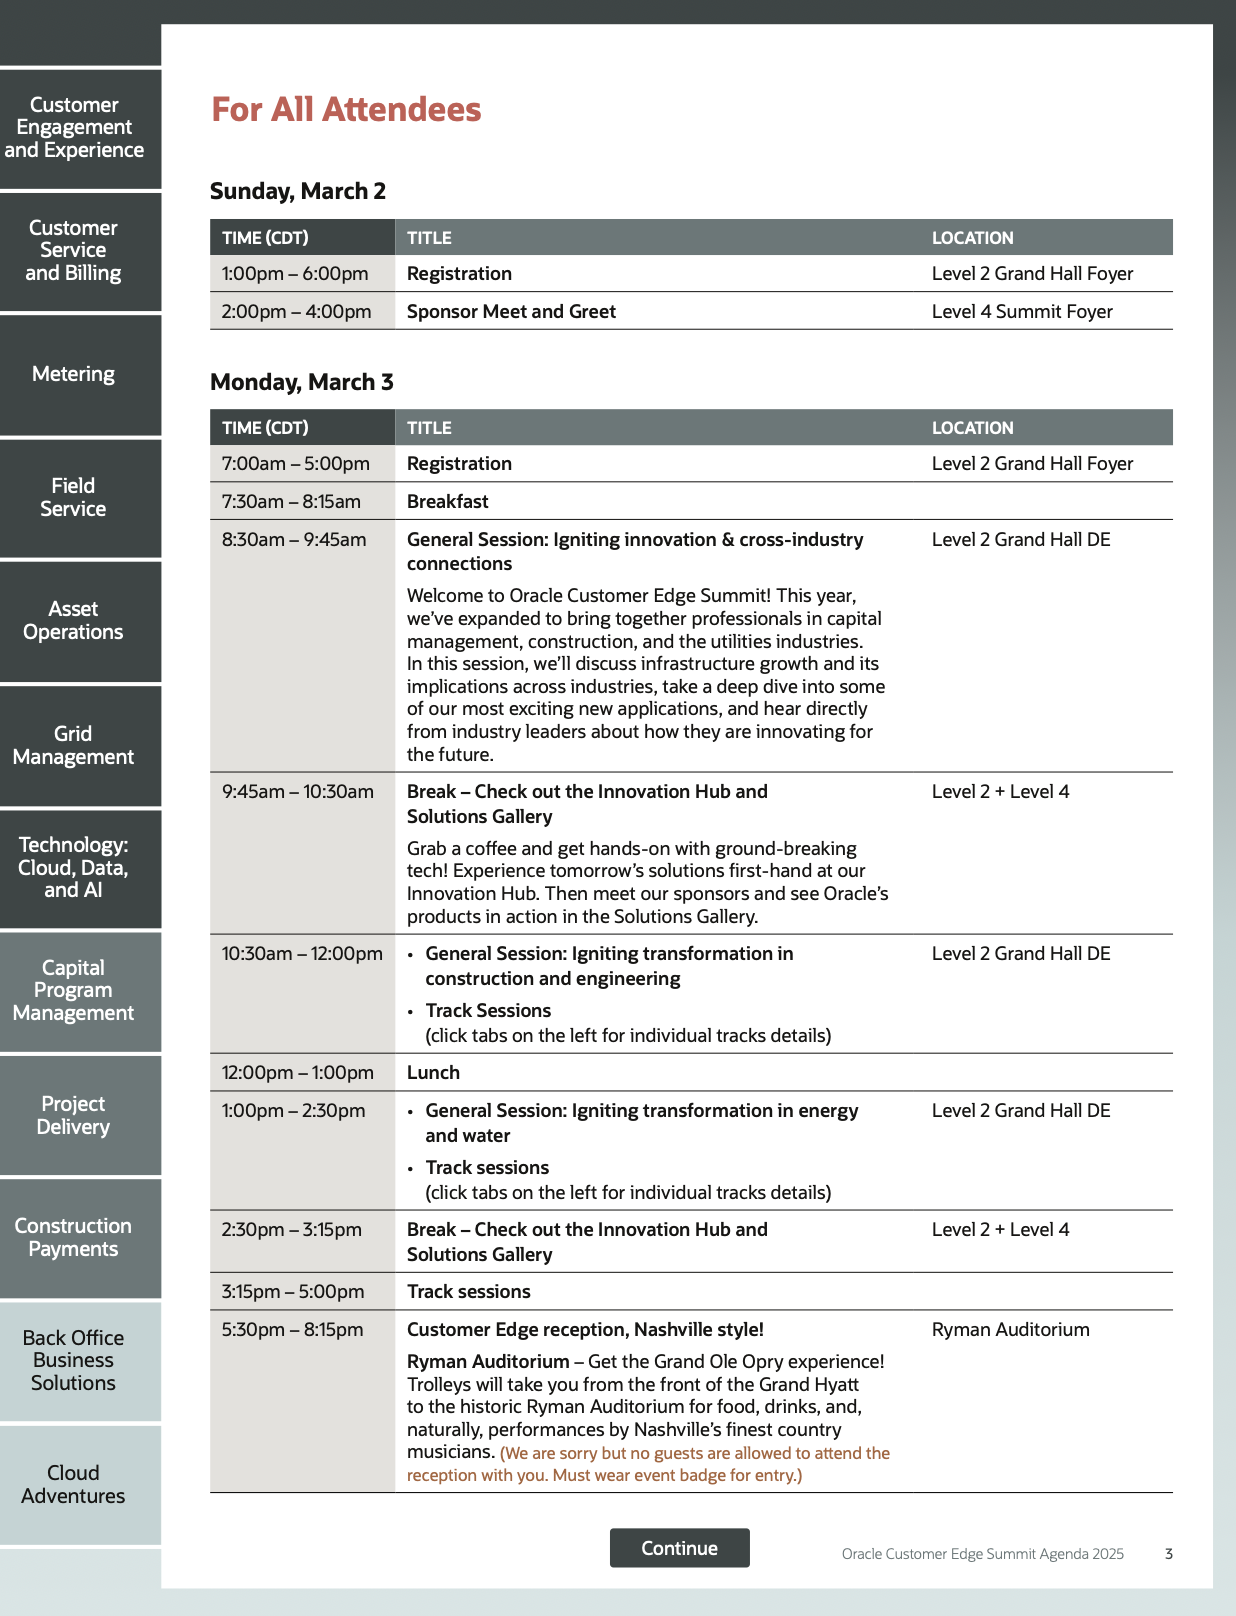
🔧 Preparation steps — complex tables
- Convert to bullet points when possible — list each row as a short sentence (e.g. "Session: Keynote | Time: 9:00 AM | Venue: Hall A").
- Write out dates and venues in full on every row — never rely on merged cells or implied context from a row above.
- Make every row self-contained — a reader (or the AI) should understand each row without reading the others.
- Remove extraneous content such as side navigation columns, banners, or decorative panels that can confuse extraction.
- If the table spans multiple pages, repeat the header row at the top of each page so column context is never lost.
- Add a short plain-text summary above or below the table describing what it covers (e.g. "This table lists all session times, speakers, and room assignments for Day 1 of the event.").
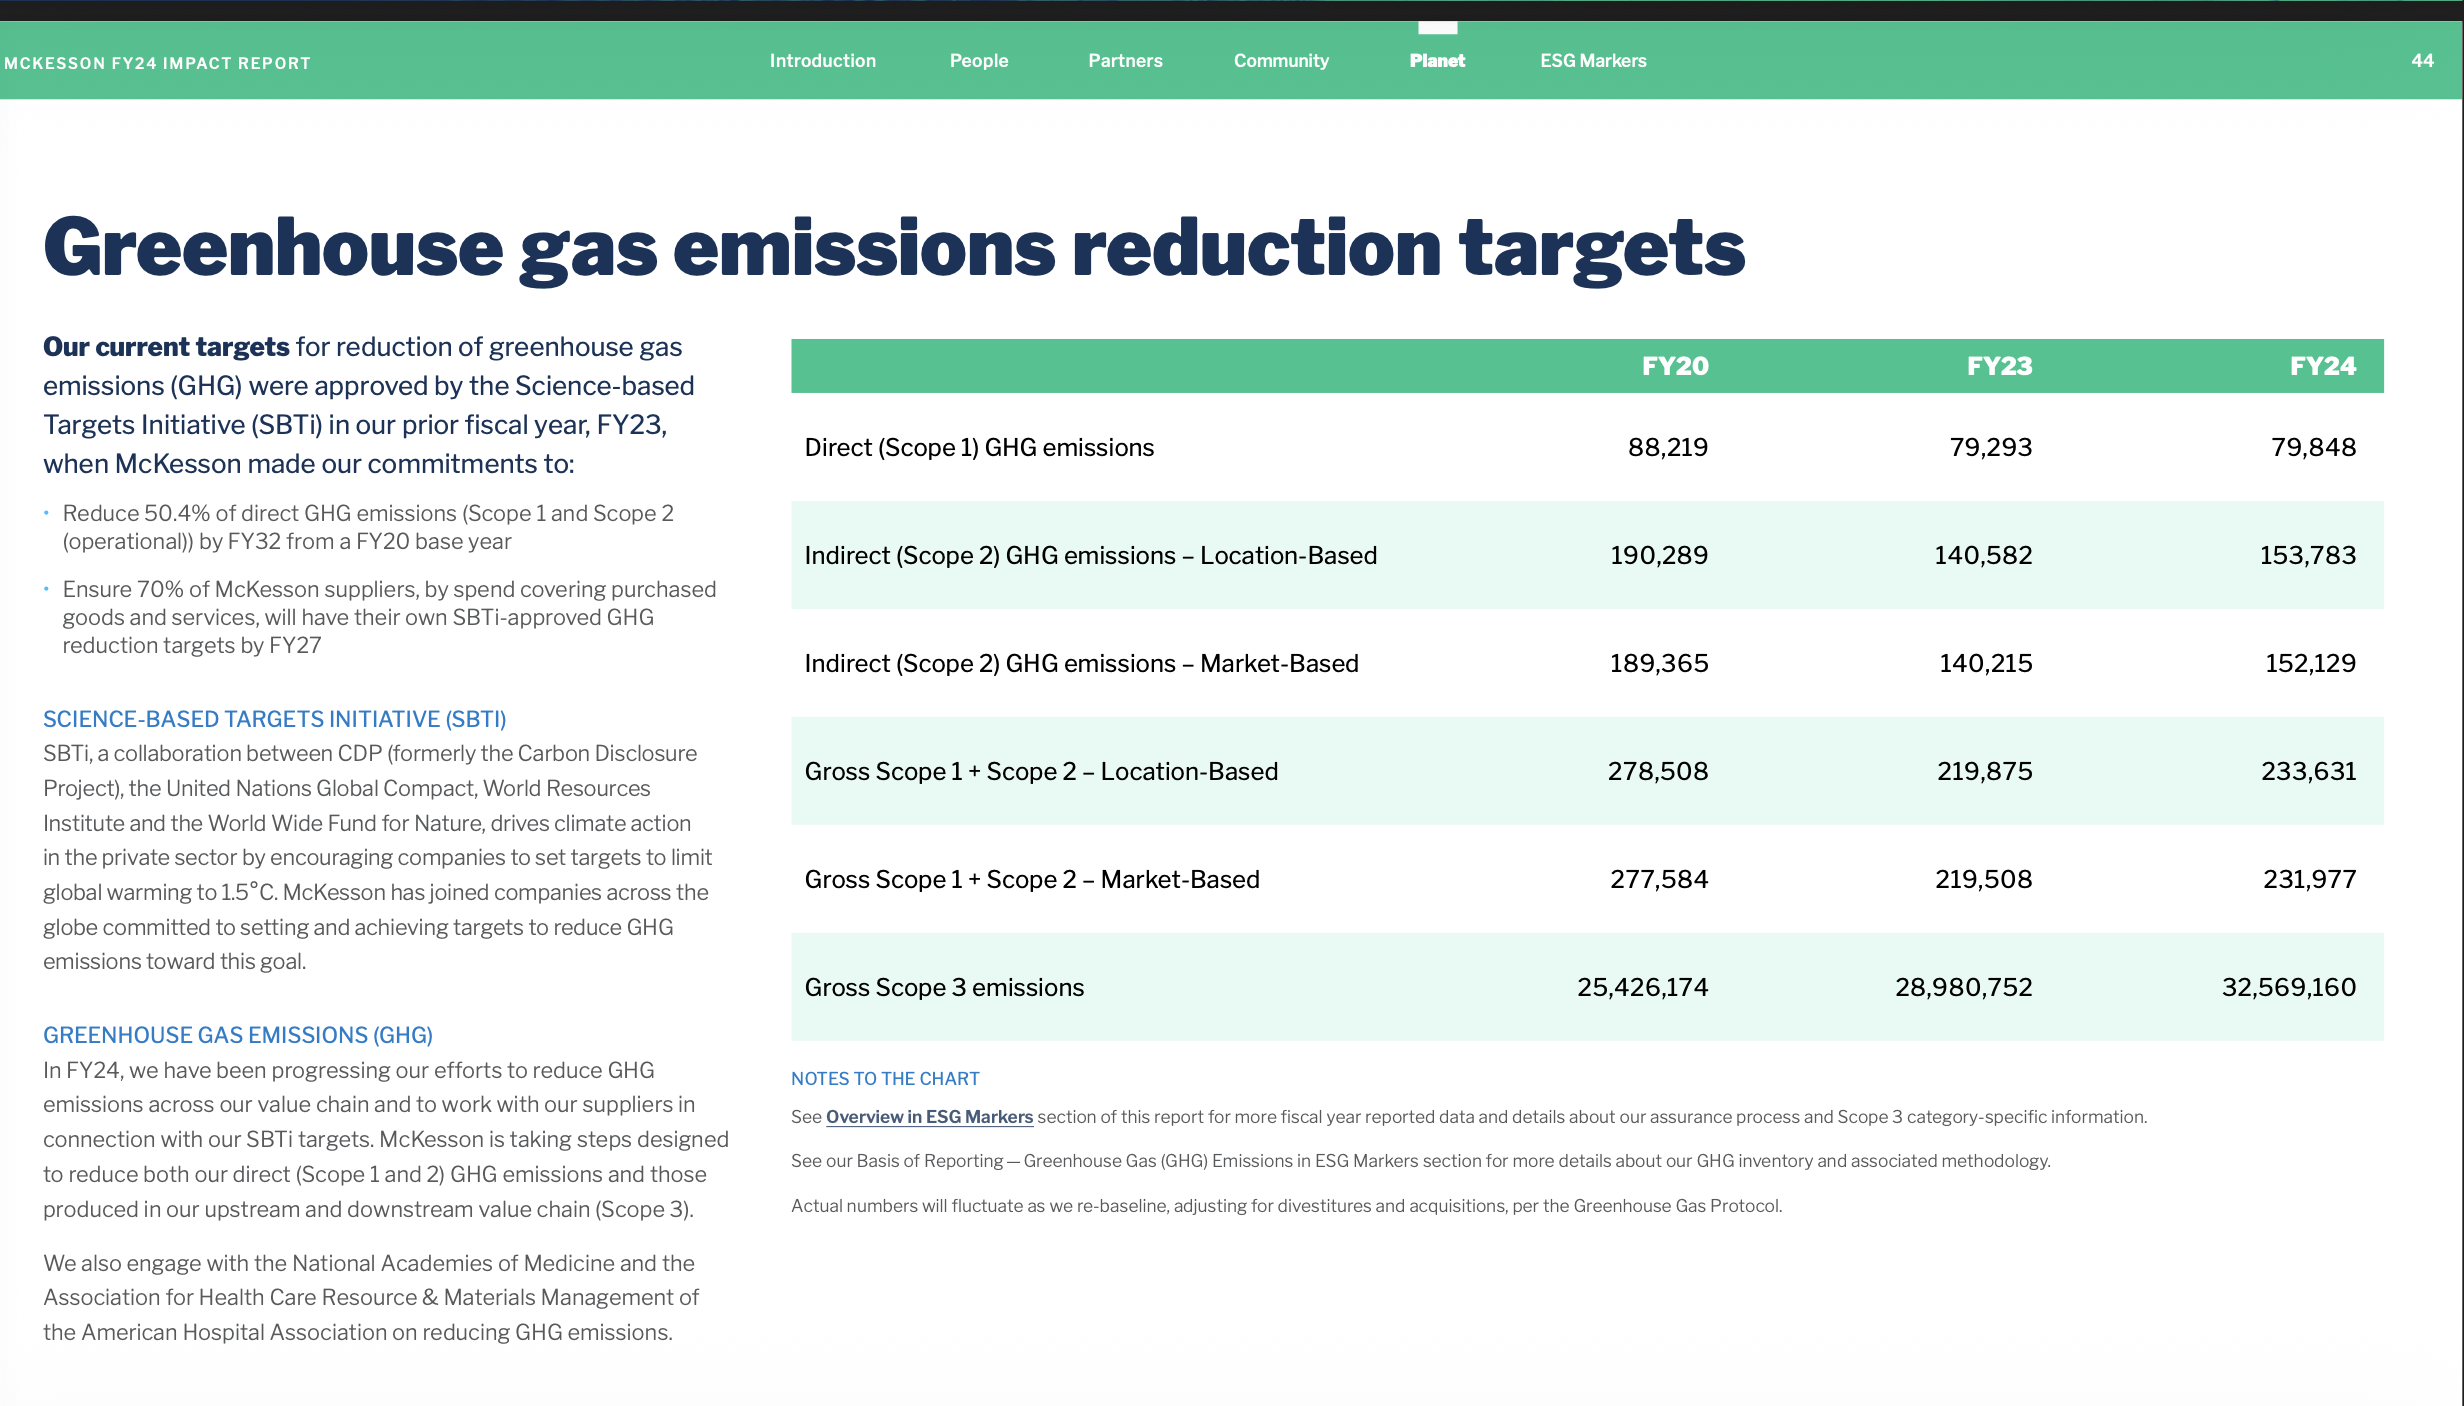
Structured data tables
Structured data tables with embedded visuals, formula-driven values, or Gantt-style layouts are not suitable for direct upload. Export only the task data as a clean, flat table.
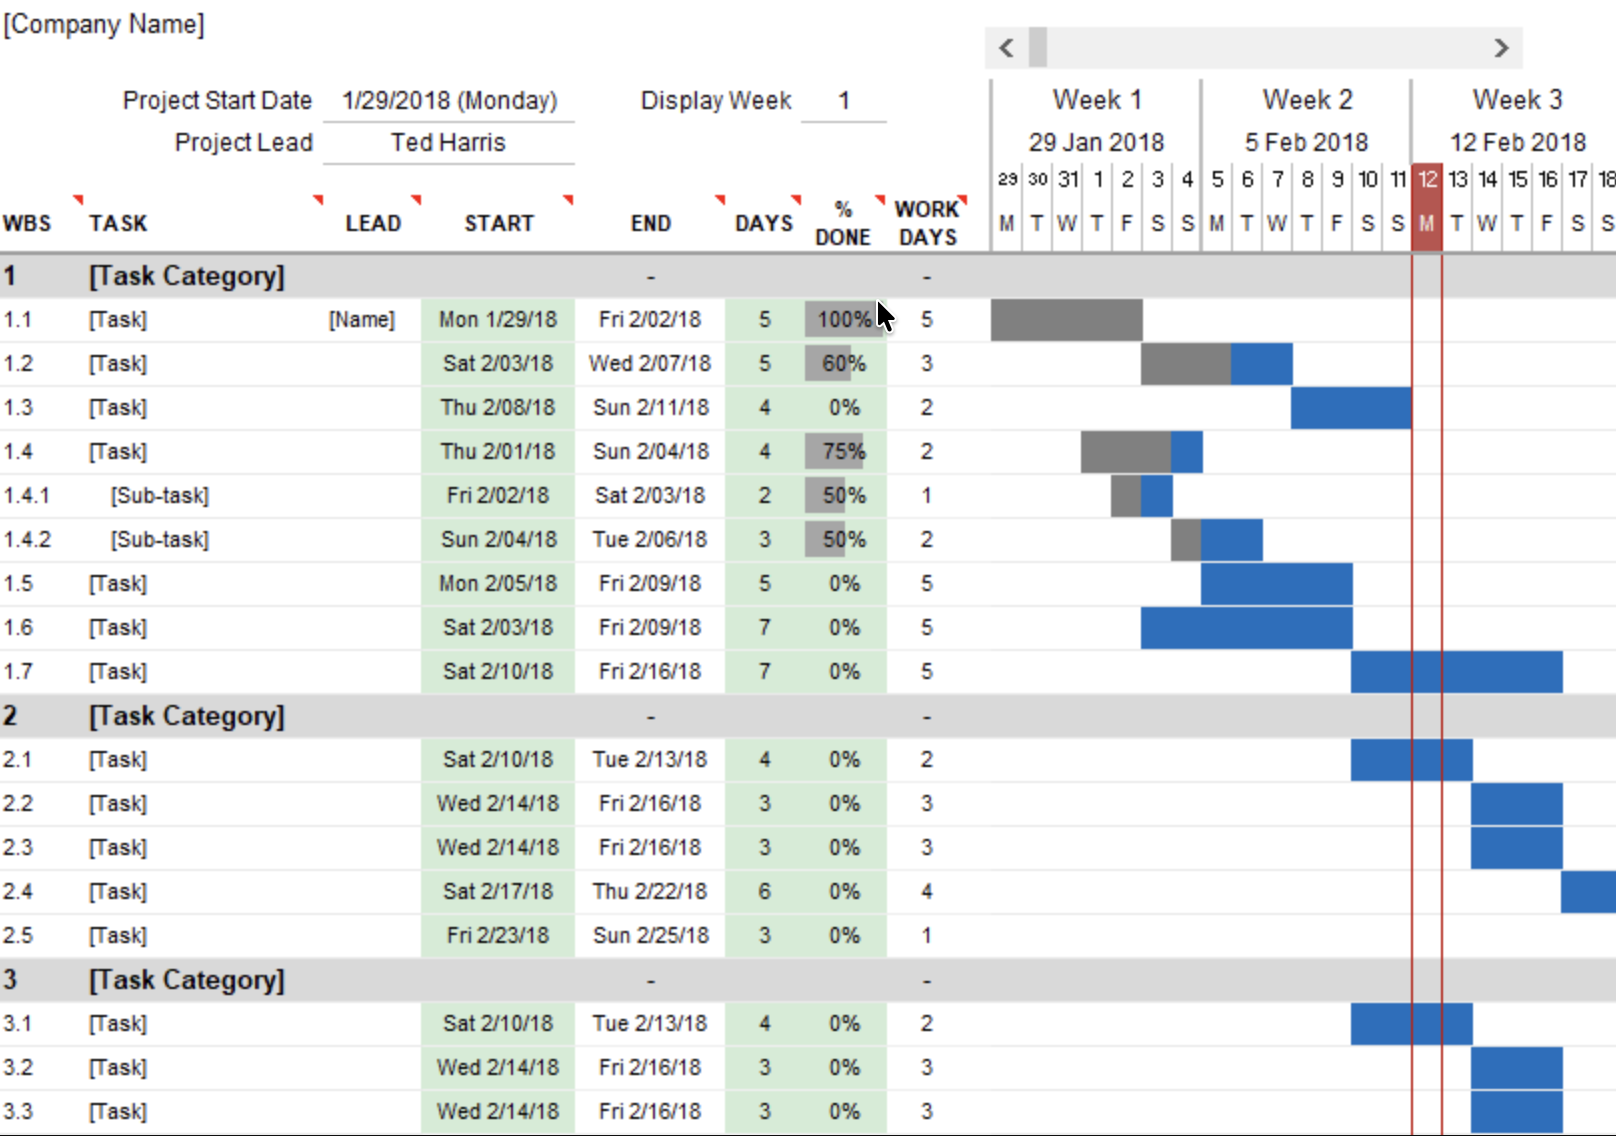
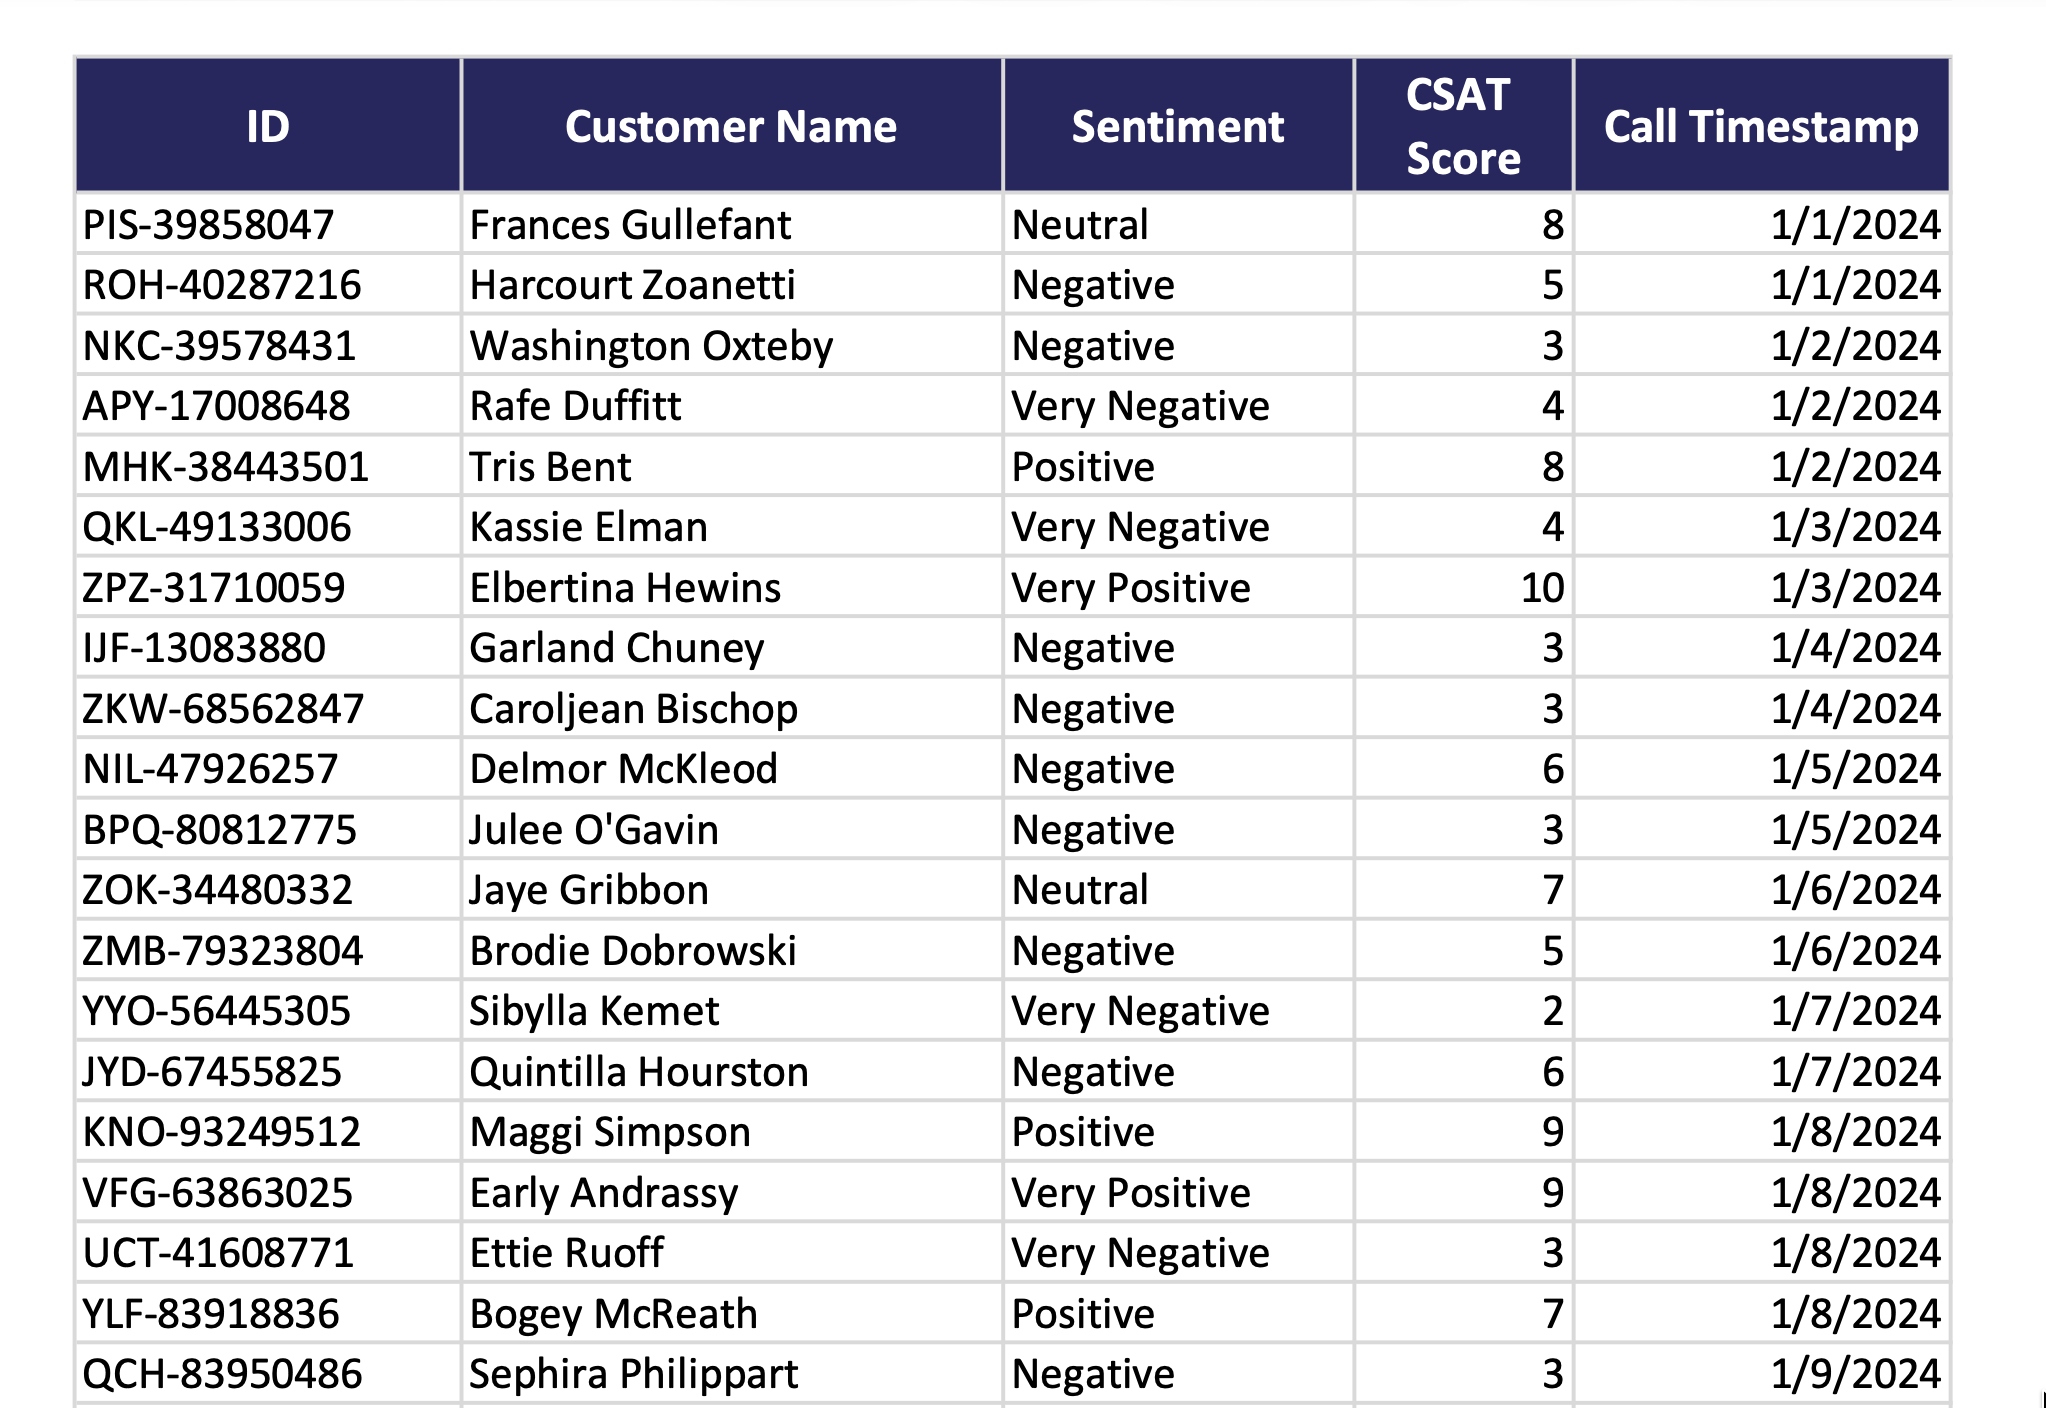
- Always pre-aggregate totals, averages, counts, and derived values before uploading. Do not rely on the AI to compute these from raw rows — results may be unreliable.
- Limit rows and columns. Avoid wide tables or dense matrices.
- Row-level lookups for specific records (IDs, names, values) are reliable. Validate in the sandbox before using in production.
- Summarize key outcomes (totals, trends, decisions) in plain text alongside the table — this gives the AI a reliable reference without requiring calculation.
- Split large workbooks into smaller, topic-specific summaries.
Charts and data visualizations
Charts are visual by nature. The AI needs the underlying numbers in text to interpret the chart correctly.
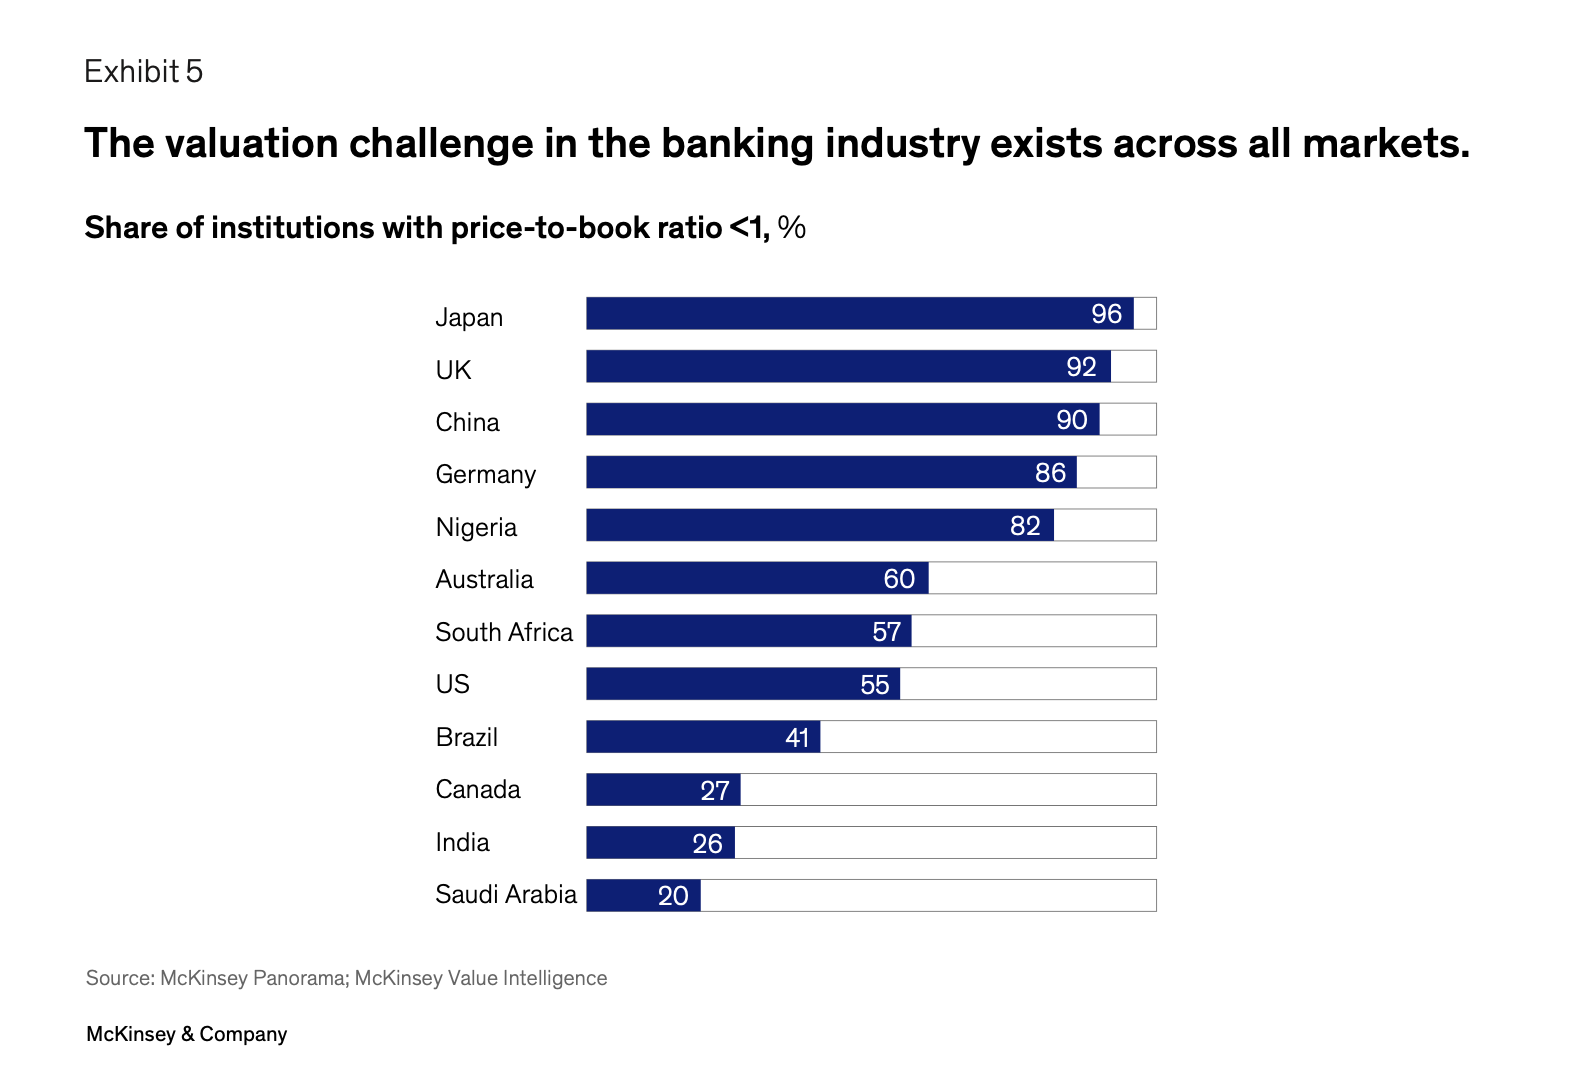
🔧 Preparation steps — charts
- Extract values into a short table or bullet list.
- Include units and time periods in the text (e.g. 2024 Q3, USD).
- Keep the chart image as optional visual context, but lead with the data list.
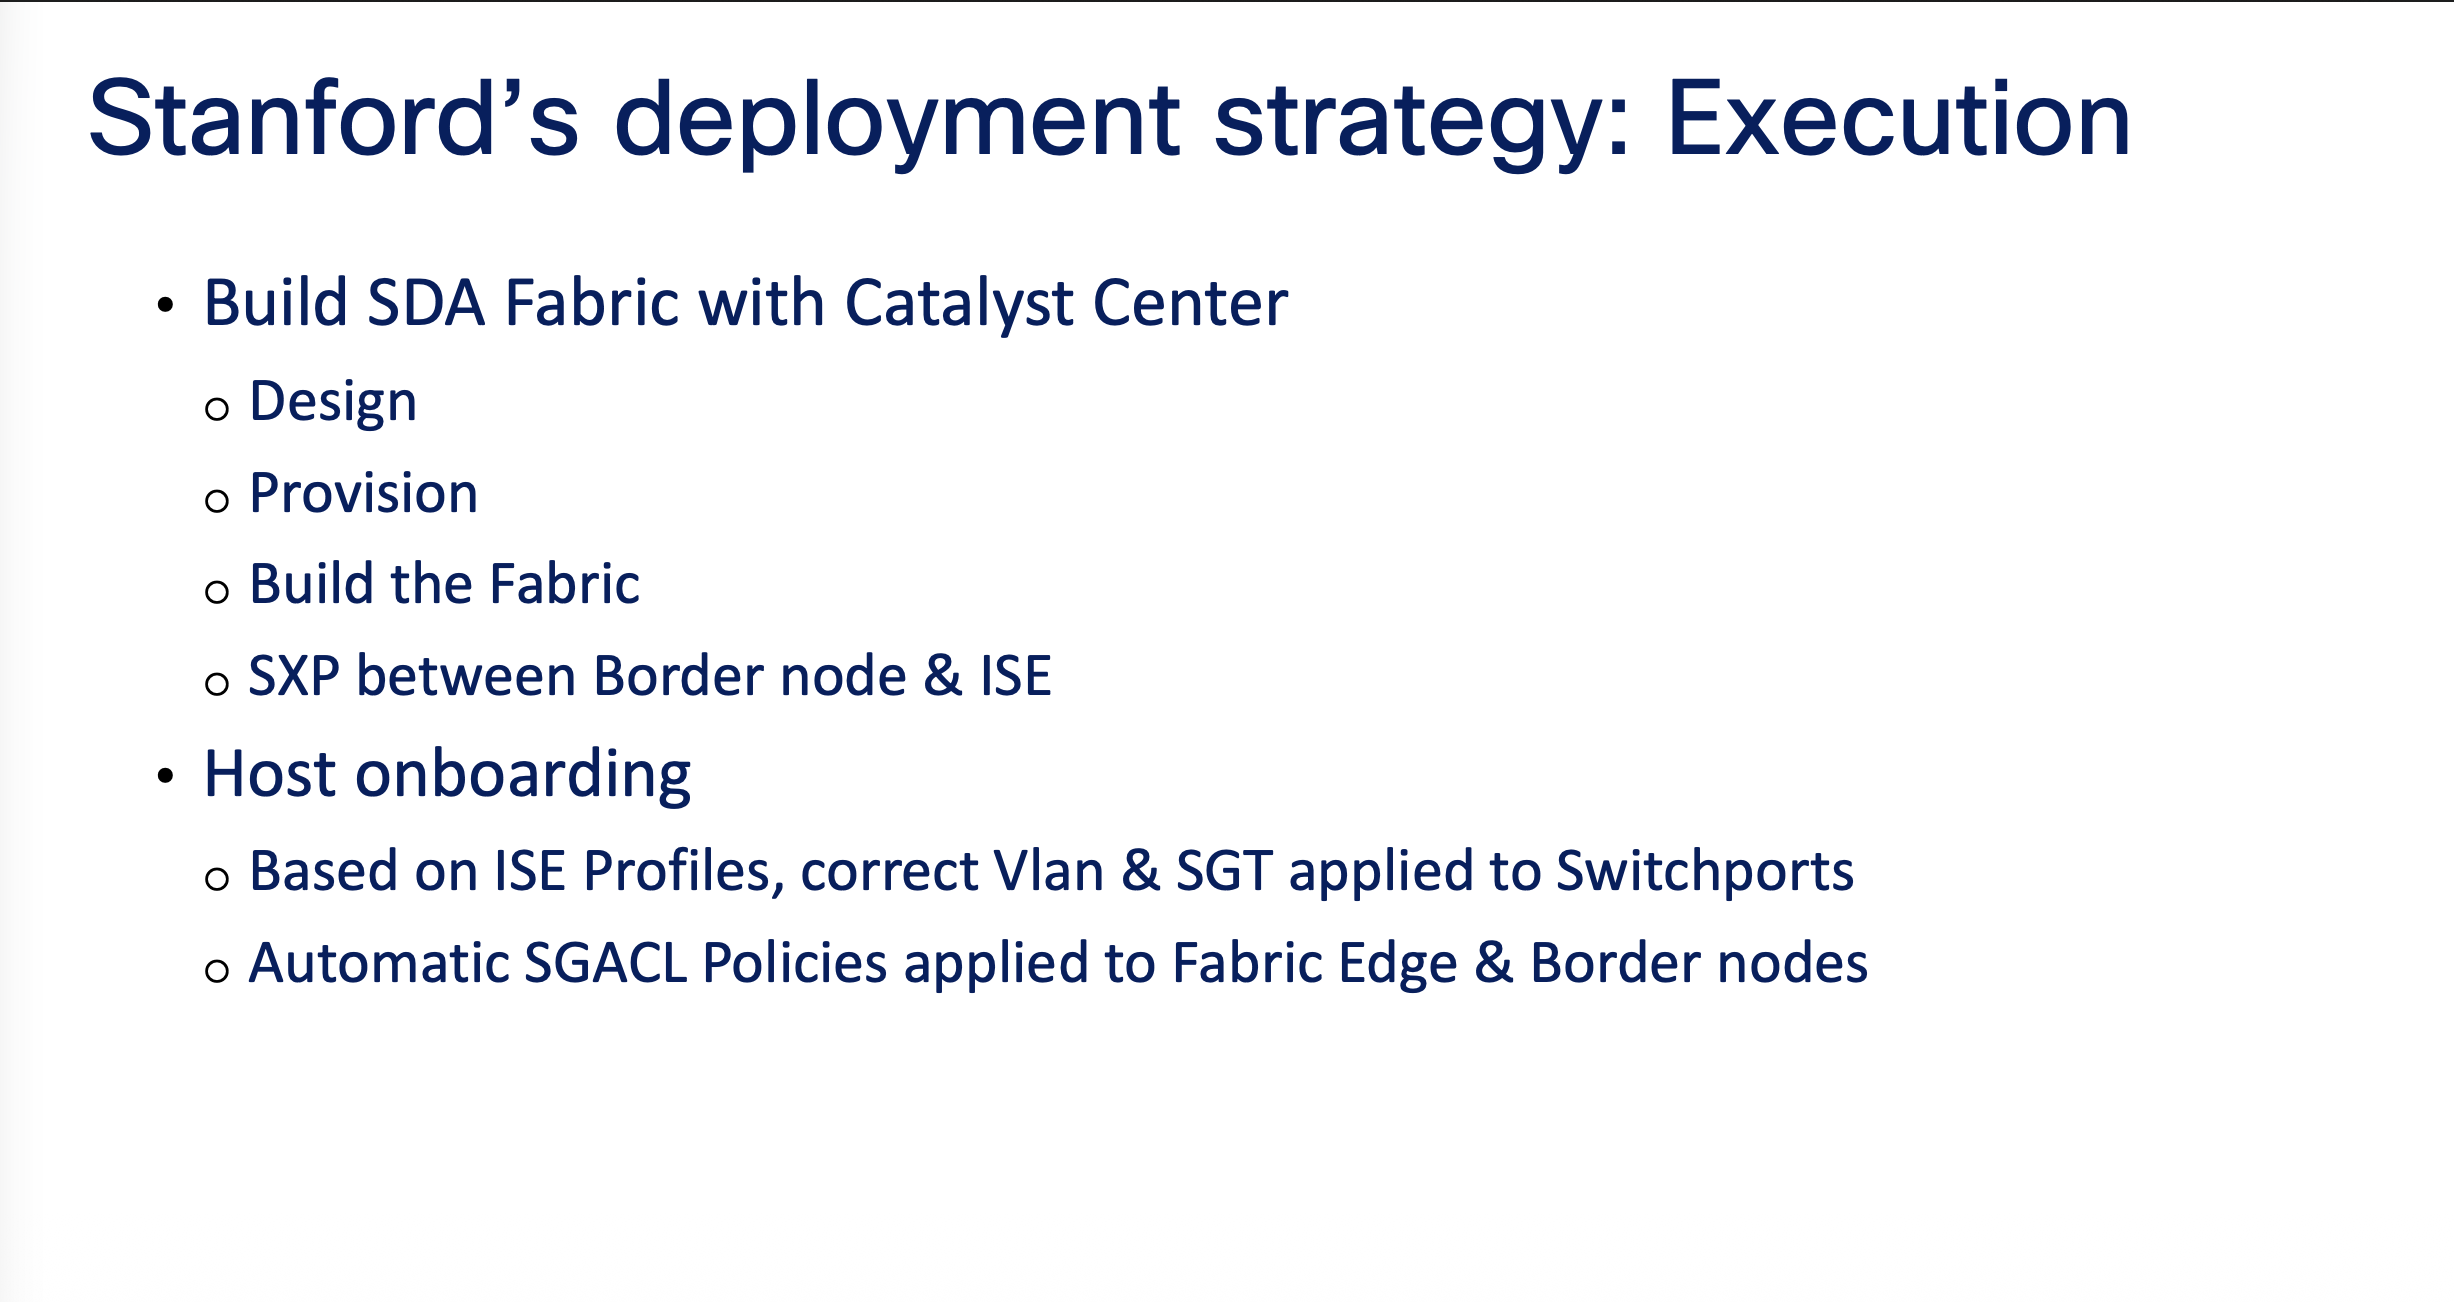
Technical diagrams and process flows
Diagrams encode meaning through layout and arrows. Provide a text version so the AI can follow the relationships.
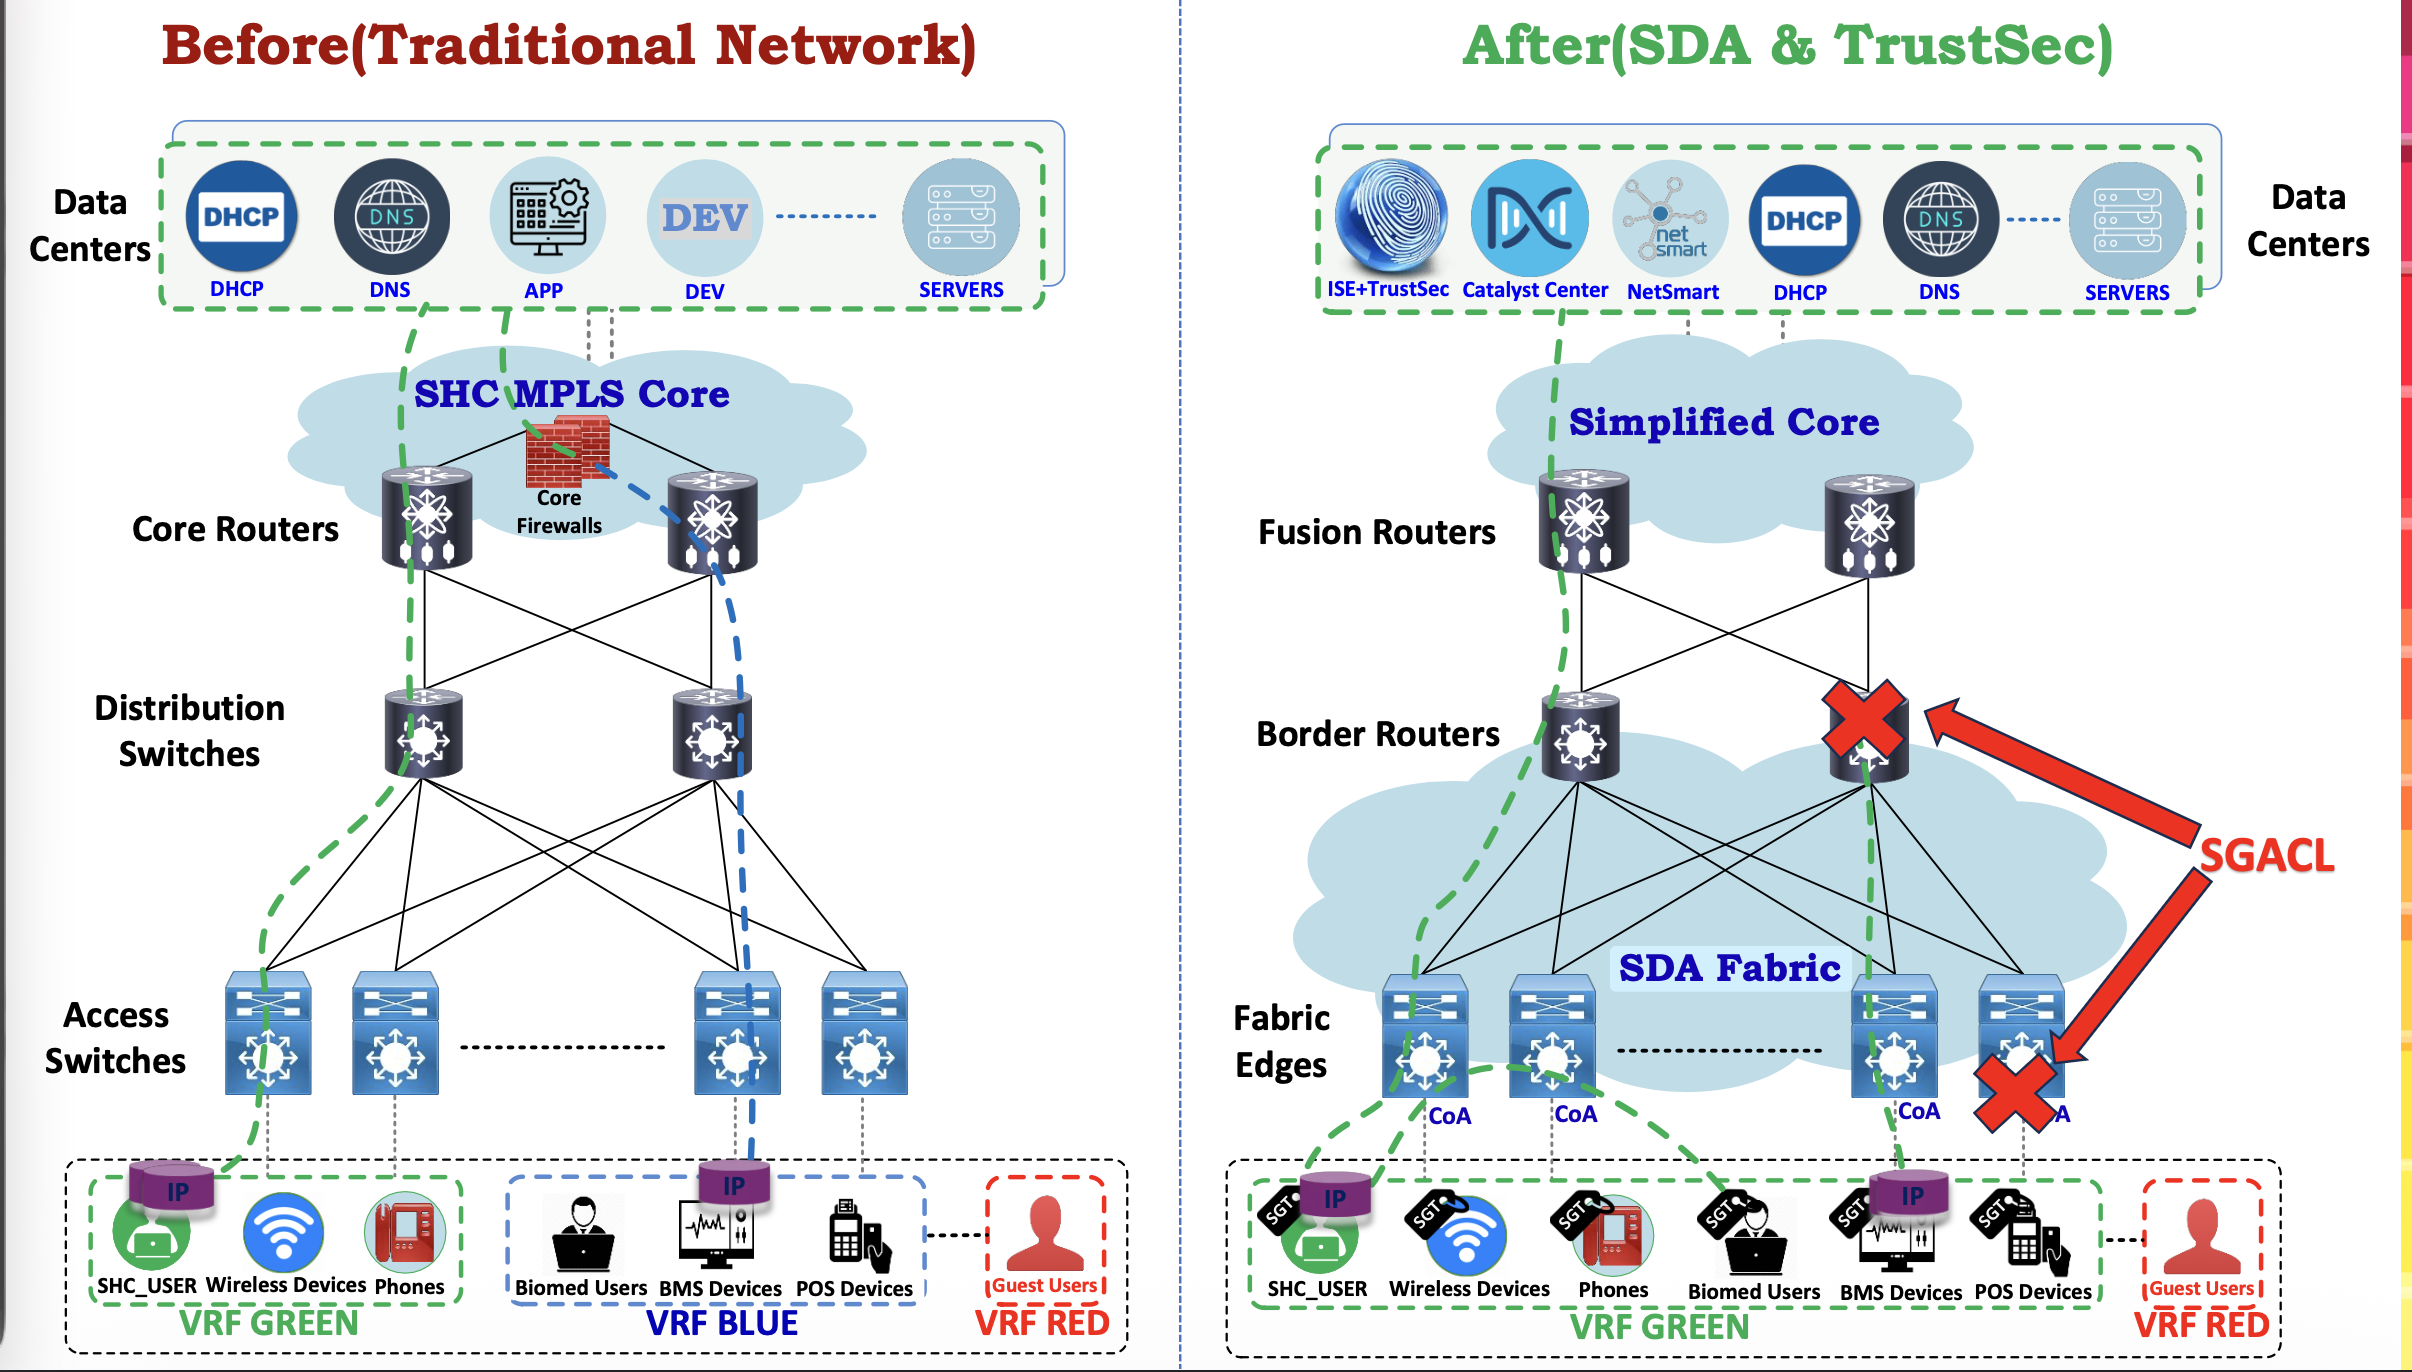
🔧 Preparation steps — diagrams
- List the main components and what each one does.
- Describe connections in a simple A -> B format.
- Group components by layer or zone (e.g. Edge, Core, Data).
- Add a short legend for icons or colors used in the diagram.
Pre-upload checklist
A summary of the preparation steps covered in this guide.
- Use headings and bullets — Keep each section short and focused
- Remove noise — Delete irrelevant pages, duplicate content, or filler text
- Flatten complex tables — One header row, no merged cells
- Turn charts into text — Provide the data values in a list or table
- Describe diagrams — Add a text summary of components and flows
- Check image quality — Ensure text is sharp, high-contrast, and readable
- Keep one topic per file — Split large multi-topic documents when possible
- Sanity check readability — If you can scan it quickly, the AI can too
Quick reference
| ✅ Great as-is | ⚠️ Needs preparation |
|---|---|
| Digital PDFs with clear headings | Scanned PDFs with skewed or faint text |
| DOCX with short sections and lists | Tables with merged cells or multi-row headers |
| PPTX with one idea per slide | Charts without printed values |
| Plain text transcripts | Technical diagrams without a text summary |
| Readable images with high-contrast text | Low-contrast images or patterned backgrounds |
Validate in the sandbox
Use the ZipTier Sandbox (testing environment) to verify response quality after uploading your documents. If responses are not accurate, refine the source content using this guide and reupload the documents.