Metrics
The Metrics section in ZipTier provides a visual breakdown of your campaign's performance, making it easy to spot trends, measure engagement, and understand the behavior of your audience. All charts are interactive, hover to see exact values and use the date range selector to analyze performance across different time periods.
Available Metrics
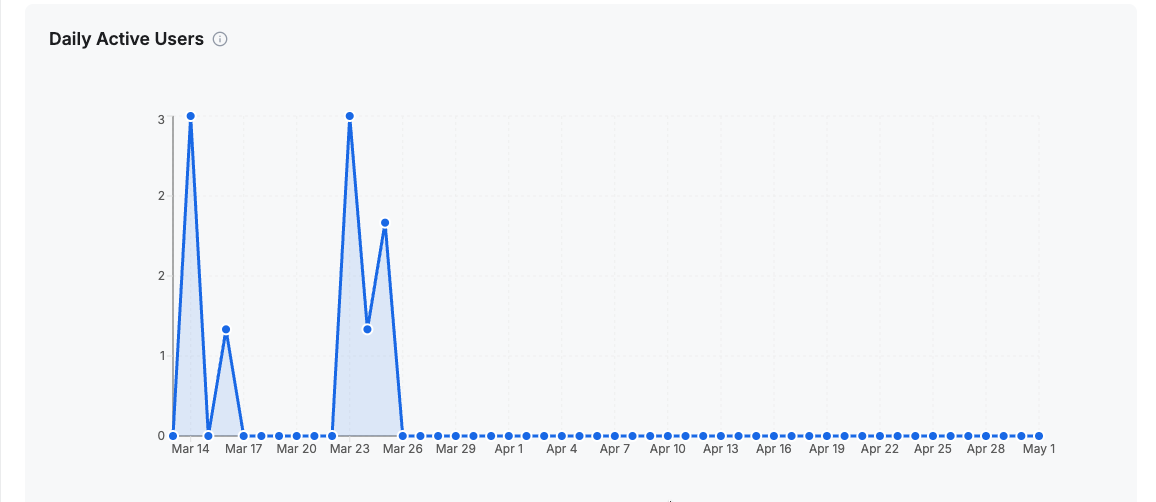
- Daily Active Users
- Line graph showing the number of unique users engaging with your AI Assistant over the selected time range.
- Helps you understand traffic patterns, peak activity periods, and campaign reach.
Below is the Daily Active Users line chart, showing unique user counts across the selected date range.
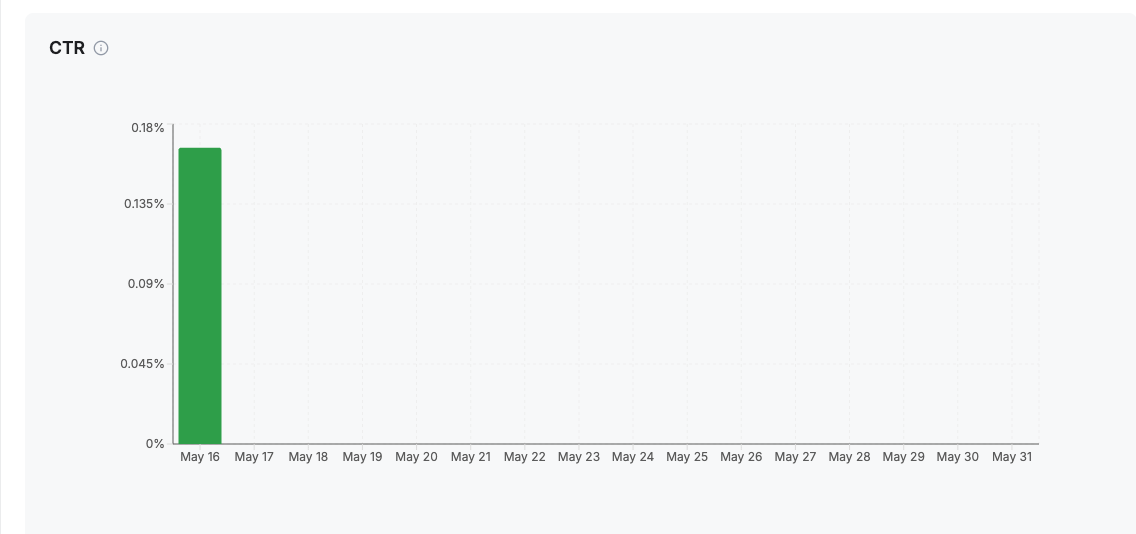
- CTA Click Trend
- Line graph showing the trend of call-to-action (CTA) performance over time.
- Useful for identifying which days or campaigns drove the strongest user actions.
Below is the CTA Click Trend chart, showing click-through rate over the selected date range.
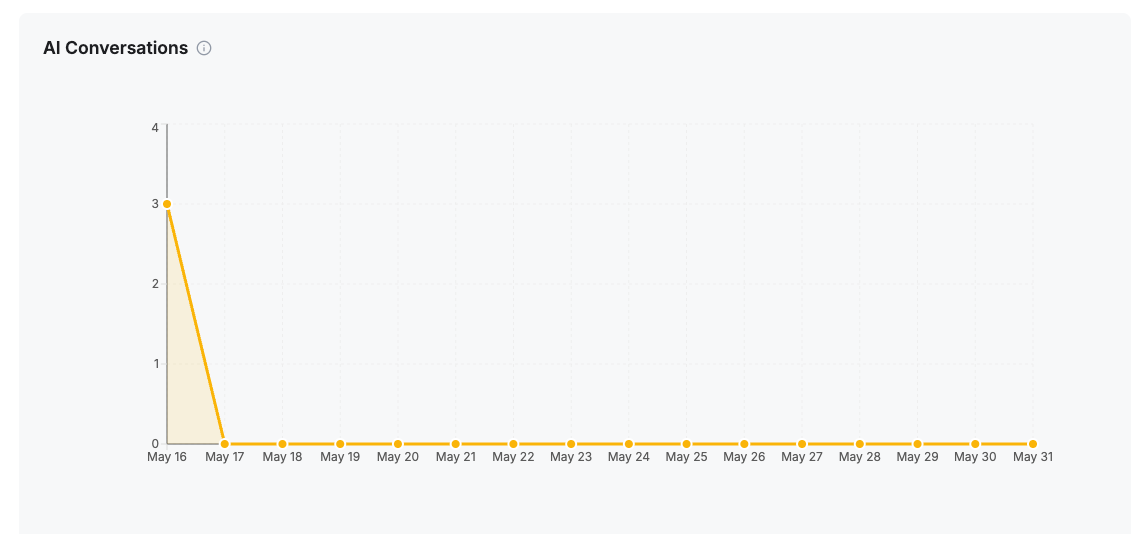
- AI Conversations Consumed
- Bar chart showing daily AI conversation volume.
- Gives insight into how actively users are conversing with your assistant and helps forecast credit usage.
Below is the AI Conversations Consumed bar chart, showing daily AI conversation volume.
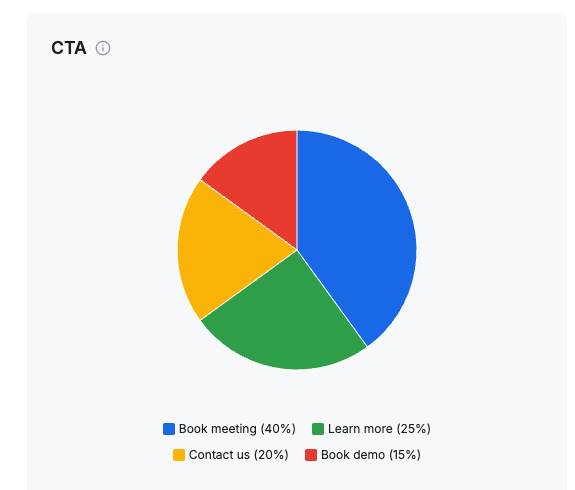
- CTA Distribution by Type
- Pie chart showing the breakdown of CTA clicks (e.g., Demo, Contact, View resources).
- Quickly identifies which CTAs are resonating with prospects and driving conversions.
Below is the CTA Distribution by Type pie chart, showing the breakdown of clicks across CTA types.
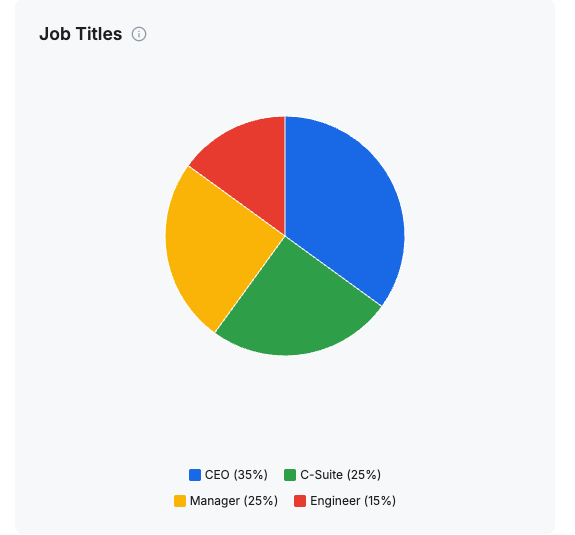
- Job Titles Distribution
- Pie chart showing the roles of leads engaging with your campaigns.
- Provides a snapshot of audience composition and whether you are reaching the right personas.
Below is the Job Titles Distribution pie chart, showing the breakdown of lead roles engaging with your campaigns.
How to Use These Metrics
- Optimize campaign timing: Use Daily Active Users data to launch promotions or outreach during peak activity hours.
- Refine CTAs: Track which CTAs perform best and adjust wording, placement, or follow-ups accordingly.
- Monitor engagement depth: AI Conversations Consumed reveals how engaged prospects are and whether they're asking meaningful questions.
- Understand audience mix: Job Titles Distribution helps validate if your campaigns are attracting decision-makers or need targeting adjustments.
- Plan resource allocation: Identify periods of high traffic and staff accordingly for faster responses or lead follow-up.
Tip: Review Metrics weekly to track trends, then pair them with the Leads and Knowledge Base Gaps panels to get a complete picture of performance and opportunities for improvement.