Visitor Analytics
Visitor Analytics shows you what happens before a chat even starts, how many people land on a page with your AI assistant, how many of them click to open it, and how many drop off before ever sending a message. Every other analytics panel begins at the first message; this one fills in the traffic that leads up to it.
Unlike the rest of the dashboard, this section reads live data instead of a twice-daily refresh, so the numbers you see reflect activity up to the moment you open it.
Turning It On
Visitor Analytics is controlled by an account-wide setting under Settings > Analytics, and is on by default for every account. Only production, on-site widget traffic is counted. Sandbox testing and standalone full-page assistants never appear in these numbers, so you can test freely without skewing your data.
| Toggle state | What happens |
|---|---|
| On (default) | New visits, clicks, and conversions are recorded as they happen. |
| Off | No new visits are recorded. Data already collected stays visible in the dashboard until it ages out after 60 days. |
Date Range
Choose from four presets: Today, Last 7 days, Last 30 days, or a Custom range. A custom range can span up to 31 days at a time, and you can look back as far as 60 days.
1. KPI Cards
Six cards summarize the selected range at a glance. Every card except Total page visits counts each visitor only once, no matter how many pages they viewed or messages they sent.
| Card | What it counts |
|---|---|
| Total page visits | Every page view in the range, including repeat views by the same visitor. |
| Total visitors | Distinct people who visited in the range. |
| Visitors (bot clicks) | Distinct visitors who clicked to open the AI assistant. |
| Leads Captured | Distinct visitors who shared their contact details in the range, however that happened. |
| Visitors (chat) | Distinct visitors who sent at least one message to the bot within the selected date range. |
| Visitors (engaged chat) | Visitors (chat) whose conversation had three or more back-and-forth exchanges. |
Below is the KPI card row, summarizing total page visits, total visitors, bot clicks, leads captured, chat visitors, and engaged chat visitors.

2. Daily Trend
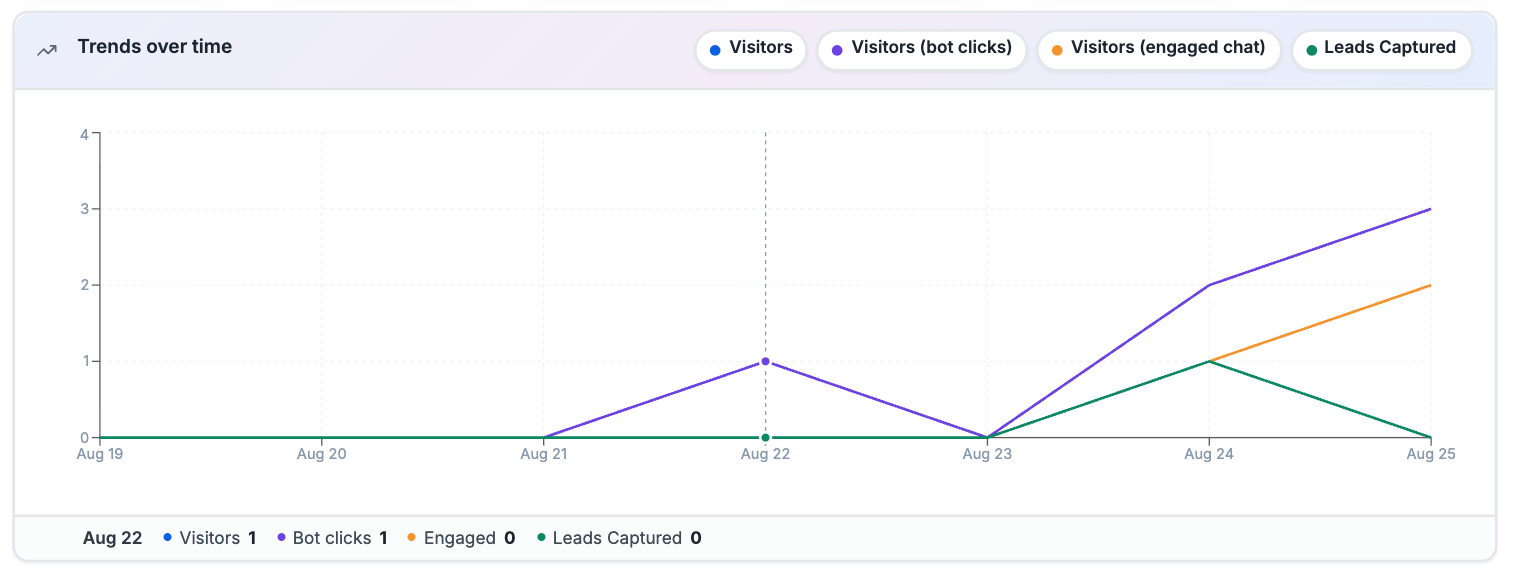
A line chart plots Visitors, Visitors (bot clicks), Visitors (engaged chat), and Leads Captured per day, so you can toggle series on or off to compare the ones you care about. Hovering over the chart shows the exact values for that day below the graph.
Below is the Daily Trend chart, plotting visitors, bot clicks, engaged chat, and leads captured per day.
3. Conversion Funnel
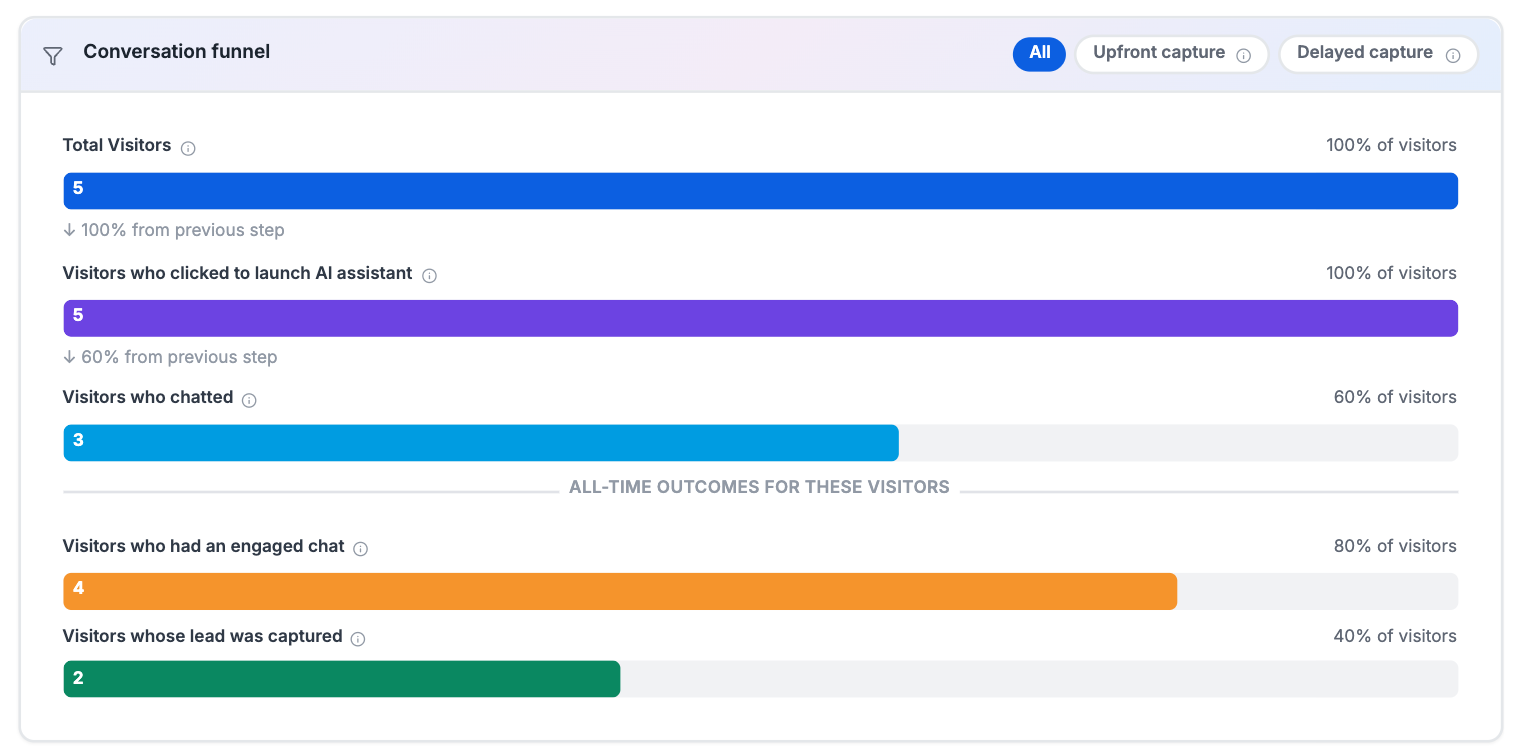
The funnel shows two things side by side, separated by a divider: how visitors moved through the range you selected, and what those same visitors have ever done, at any point in time.
| Scope | Steps | What it means |
|---|---|---|
| Range | Total Visitors → Visitors who clicked to launch AI assistant → Visitors who chatted | Chained: each step shows the percentage drop-off from the step before it, within the selected dates only. |
| Lifetime | Visitors who had an engaged chat, Visitors whose lead was captured | Not chained to the range steps. A visitor who only browsed this week but engaged or converted previously still counts here, which is why a lifetime step can be higher than the range step above it. |
Each step has its own info icon explaining exactly what it counts. If a campaign uses both Upfront capture and Delayed capture lead-capture modes within the same range, mode tabs (All, Upfront capture, Delayed capture) appear above the funnel so you can view each mode's funnel separately. Hover their info icons for what Upfront capture (asked before the conversation begins) and Delayed capture (asked during the conversation, or once high intent is detected) mean.
Below is the Conversion Funnel, showing the range steps and lifetime steps side by side.
4. Returning vs. New & Avg. Visits per Visitor
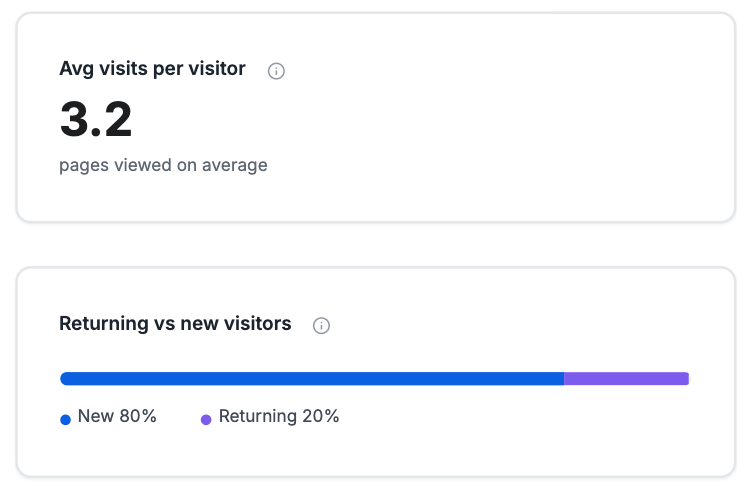
- Returning vs. New: the split between visitors seeing your site for the first time and visitors coming back on a later day.
- Avg. Visits per Visitor: total page visits divided by the number of visitors who viewed at least one page.
Below is the Returning vs. New split alongside Average Visits per Visitor.
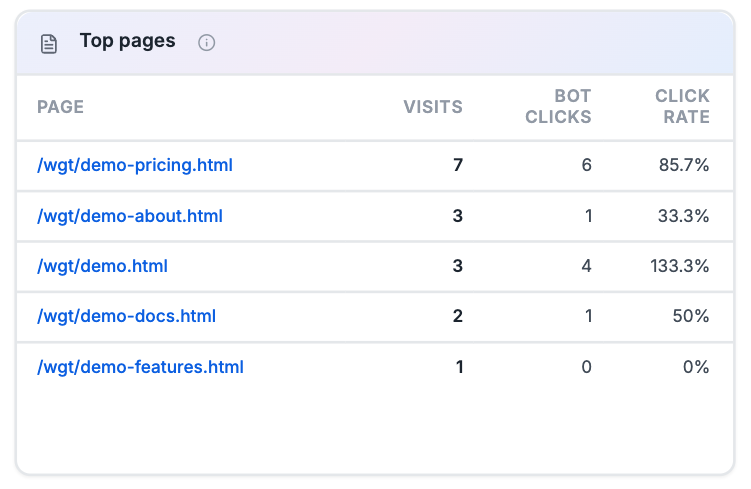
5. Top Pages
The five pages with the most visits in the range, each shown with its own bot-click count.
Below is the Top Pages list, showing the five most-visited pages with their bot-click counts.
6. Peak Activity Hours
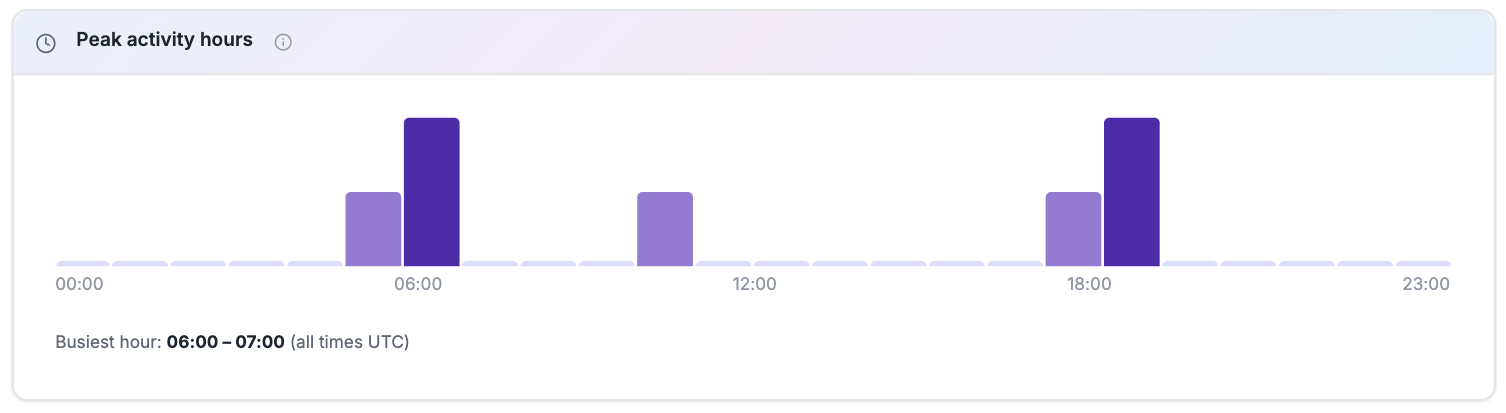
A 24-hour chart showing when visitors are most active, in UTC. Because a visitor's own time zone isn't recorded, all times are shown in UTC rather than guessed at.
Below is the Peak Activity Hours chart, showing visitor activity by hour in UTC.